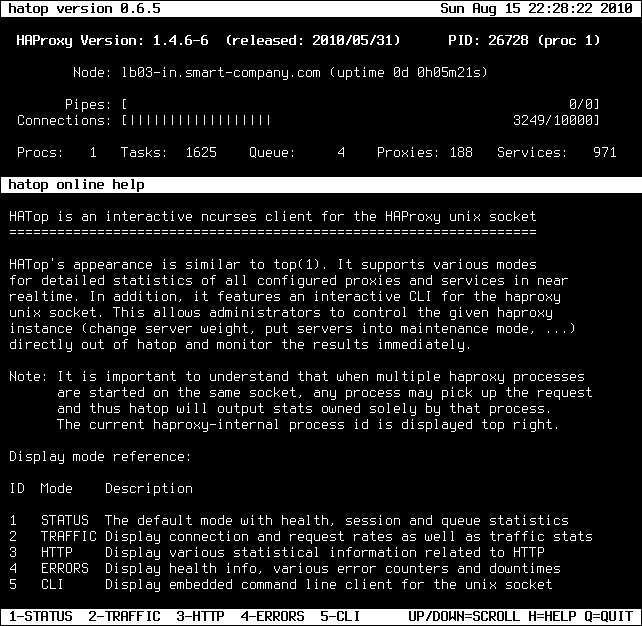
Short screenshot tour showing all screen modes / viewports in action.
Global header reference (visible in all modes):
Node        configured name of the haproxy node
Uptime      runtime since haproxy was initially started
Pipes       pipes are currently used for kernel-based tcp slicing
Procs       number of haproxy processes
Tasks       number of actice process tasks
Queue       number of queued process tasks (run queue)
Proxies     number of configured proxies
Services    number of configured services
Screenshot:
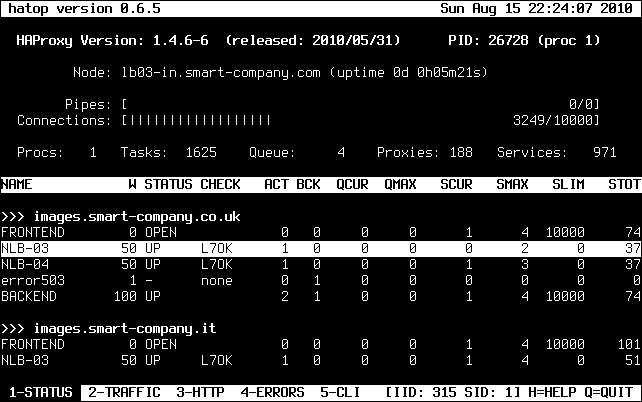
Header reference:
NAME        name of the proxy and his services
W           configured weight of the service
STATUS      service status (UP/DOWN/NOLB/MAINT/MAINT(via)...)
CHECK       status of last health check (see status reference below)

ACT         server is active (server), number of active servers (backend)
BCK         server is backup (server), number of backup servers (backend)
QCUR        current queued requests
QMAX        max queued requests
SCUR        current sessions
SMAX        max sessions
SLIM        sessions limit
STOT        total sessions
Screenshot:
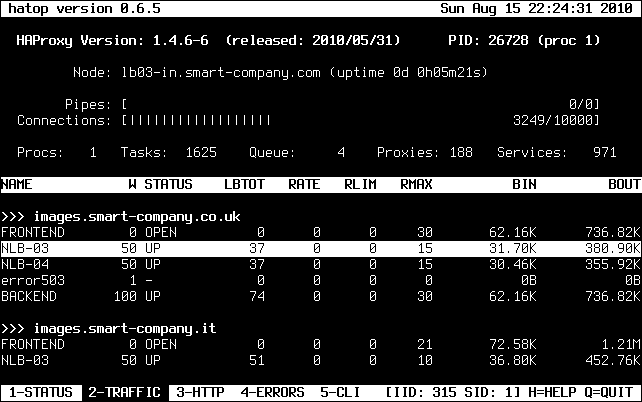
Header reference:
NAME        name of the proxy and his services
W           configured weight of the service
STATUS      service status (UP/DOWN/NOLB/MAINT/MAINT(via)...)

LBTOT       total number of times a server was selected
RATE        number of sessions per second over last elapsed second
RLIM        limit on new sessions per second
RMAX        max number of new sessions per second
BIN         bytes in (IEEE 1541-2002)
BOUT        bytes out (IEEE 1541-2002)
Screenshot:
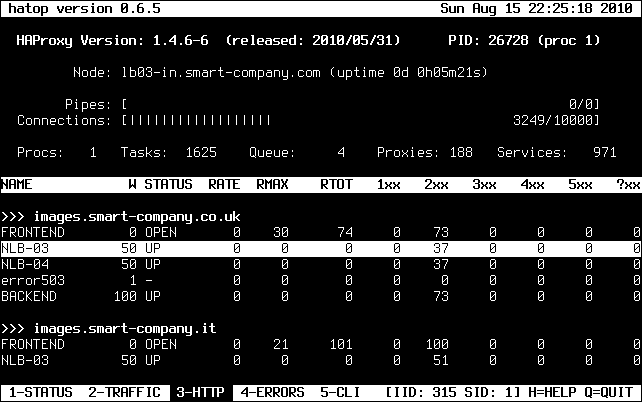
Header reference:
NAME        name of the proxy and his services
W           configured weight of the service
STATUS      service status (UP/DOWN/NOLB/MAINT/MAINT(via)...)

RATE        HTTP requests per second over last elapsed second
RMAX        max number of HTTP requests per second observed
RTOT        total number of HTTP requests received
1xx         number of HTTP responses with 1xx code
2xx         number of HTTP responses with 2xx code
3xx         number of HTTP responses with 3xx code
4xx         number of HTTP responses with 4xx code
5xx         number of HTTP responses with 5xx code
?xx         number of HTTP responses with other codes (protocol error)
Screenshot:
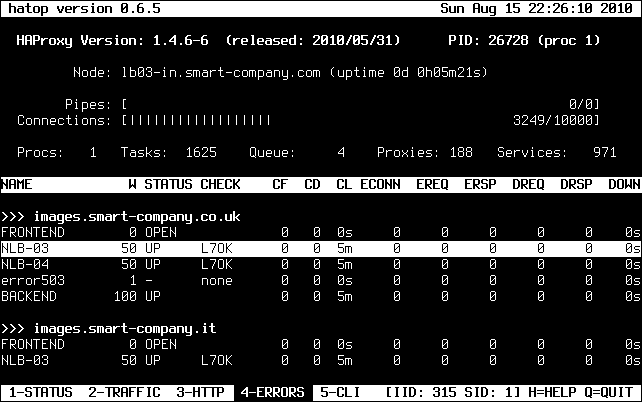
Header reference:
NAME        name of the proxy and his services
W           configured weight of the service
STATUS      service status (UP/DOWN/NOLB/MAINT/MAINT(via)...)
CHECK       status of last health check (see status reference below)

CF          number of failed checks
CD          number of UP->DOWN transitions
CL          last status change
ECONN       connection errors
EREQ        request errors
ERSP        response errors
DREQ        denied requests
DRSP        denied responses
DOWN        total downtime